 Work Receptive field analysis: spatial mapping and responses to gratings
 Short discussion of Overlap Index (OI) and other meausures of RF overlap.
Departmental seminar presentation
|
Fig. 1. Spatial mapping of receptive fields.
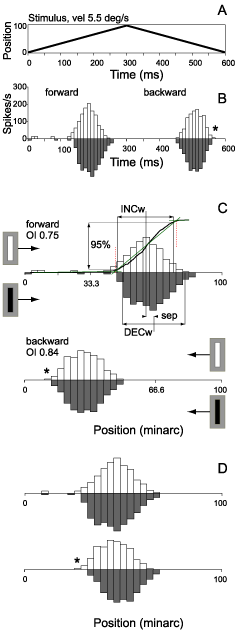
Estimation of width, location and spatial overlap of INC and DEC ARs with sweeping bars. Complex cell 18602, INCw 26 minarc, DECw 28 minarc, CRF 31 minarc, mapping bar 4 minarc wide. A: Position of the bar vs time as it is swept forward across the CRF and back at 5.5?/s. B: PSTHs of the responses in two directions of motion from several repetitions of the stimulus. Data were collected while compensating for changes in fixational eye position (Snodderly and Gur, 1995) and epochs perturbed by saccades were excluded (See Methods). Upward histograms with light bars represent INC responses and downward histograms with dark bars represent DEC responses. C: Same histograms as in B, converted to spatial dimensions with spatial position defined as the product of time and the velocity of the stimulus. The estimation of AR borders for the INC AR is illustrated for the forward (preferred) direction in the upper half of panel C. The cumulative curve for the number of spikes fired is shown, along with dashed vertical lines that denote the intersections of least-squares lines fitted to the cumulative curve. Solid vertical lines represent AR borders as defined by 95% of the response between the intersections, distributed symmetrically around the center of mass. The same process (not shown) was carried out to define the DEC AR. The separation between the INC and the DEC centers (sep) was used to calculate the overlap index, OI. Note that the space histograms for backward motion (lower half of panel C) are left-right reversed with respect to their time counterpart in B, to reflect the actual spatial arrangement of the responses. The right (trailing) edge in time, denoted by the asterisk, is the left (leading) edge in space. The relative locations of INC and DEC ARs differ slightly in the forward and backward directions, due to small differences between INC and DEC response latencies (see Results). Establishing the absolute position of the receptive field in the two directions requires taking the response latency into account, which is done in panel D. Correcting for the INC latency of 44 ms and the DEC latency of 55 ms for this cell shifts the histogram for forward motion to the left and the histogram for backward motion to the right, so that the estimate of spatial location of the ARs is consistent for the two directions. From [1] |
[1] Kagan I., Gur M., Snodderly D.M. Spatial organization of
receptive fields of V1 neurons of alert monkeys: comparison with
responses to gratings. Journal of Neurophysiology 88: 2557-2574
[reprint]
[better resolution figures]